Twenty bracket designs, sliced, scored and ranked. The lightest design was the worst to print; a weighted index picked a 19 g design over both extremes, and four test prints agreed with the printability scores (a small qualitative check).
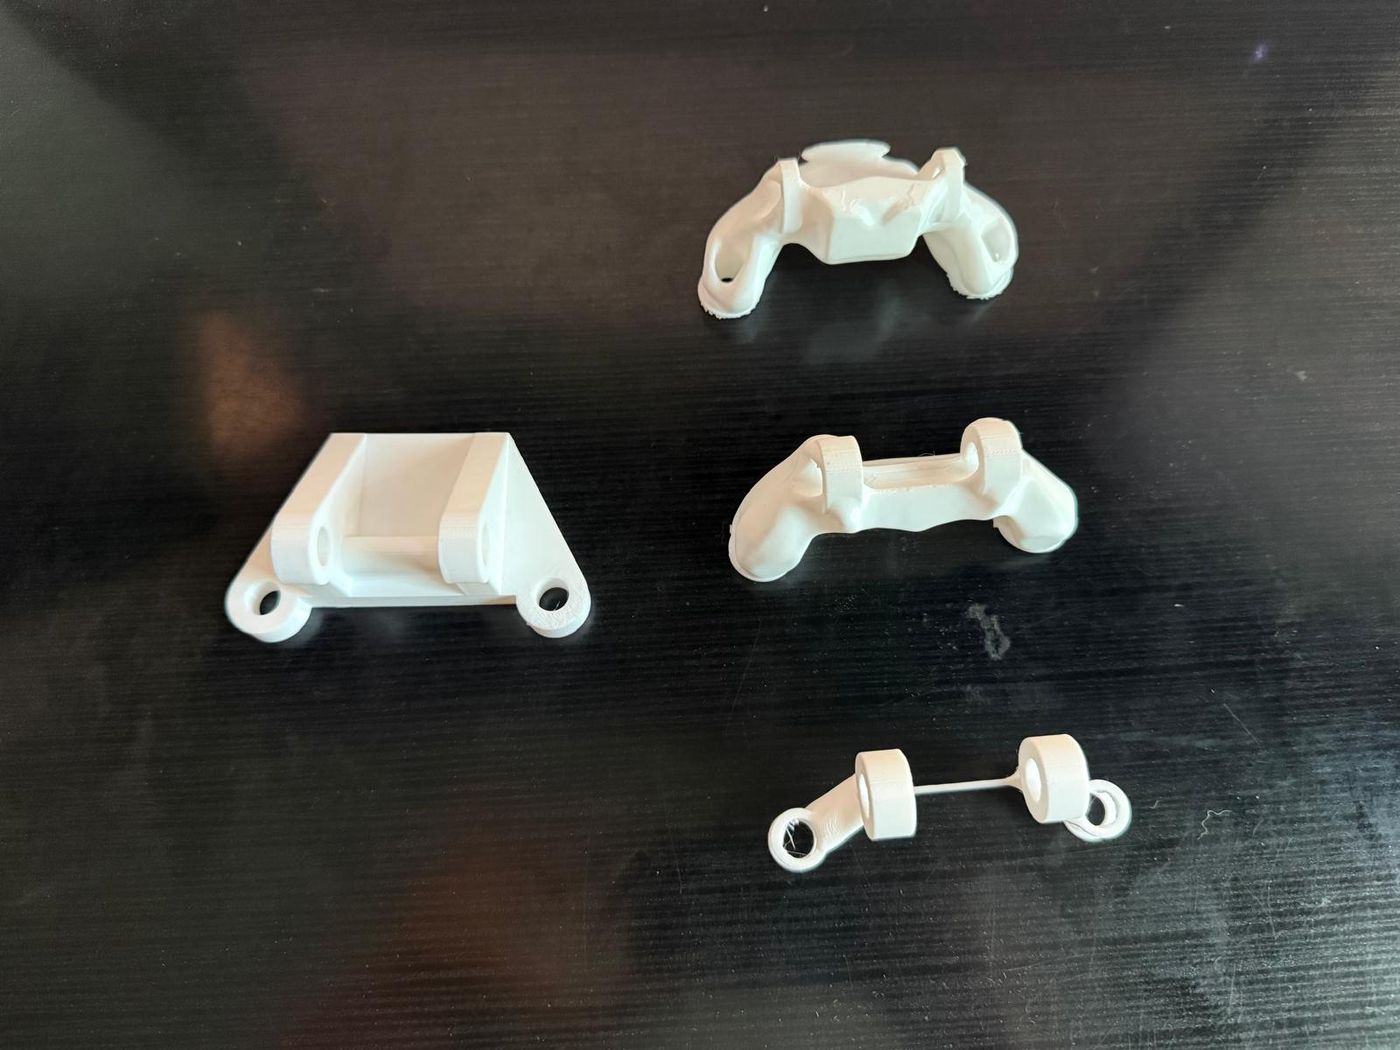
The four printed designs: the hand-modelled baseline (left) and three generative outcomes, on a Bambu Lab A1 Mini in PLA.
20 designsSliced and scored, including the baseline
65 → 9 gBaseline to lightest design
19 g pickChosen by a mass, volume, stress and printability index
4 printedAgreed with the scores; a small qualitative check
Generative design can produce brackets that pass the stress check but print badly: small bases that peel, thin necks that wobble, and heavy supports. This project scores that risk before printing. I generated nineteen brackets in Fusion 360 alongside a hand-modelled baseline, pulled print metrics for each from the slicer, scored their printability, and trained a model that predicts the score from the design and slicer data. A solo term project for ME3261 Computer-Aided Design and Manufacturing.
The result is a workflow and a selection rule: the lightest design the solver produced (9 g) was the worst to print, and a weighted index across mass, volume, stress and printability picked a 19 g design over both the 65 g baseline and the 9 g extreme. Four test prints agreed with their printability scores, a small qualitative check. Code, dataset and environment are on GitHub.
Workflow
Design space in Fusion 360. A bracket that carries a downward load from a loading region to a mounting face fixed by bolts, with obstacle regions for external rods. Preserved regions for the holes and faces; a starting shape the solver may change.
Generative design runs. ABS as a stiffness proxy for PLA. Objective: minimise mass. Varied across runs: safety factor 1.5 or 1.0; minimum thickness 3.0, 2.5, 1.5 or 1.0 mm; overhang limit 45° or 70°; manufacturing constraints on or off; realistic or extended build orientations.
Slicing. Nineteen outcomes plus one hand-modelled baseline exported as STL and sliced in Bambu Studio for the A1 Mini with default PLA settings and supports on. Recorded per design: support mass and volume, print time, total material.
Scoring. Three geometric risk flags from inspecting each part and its slice preview (small base, thin neck, complexity), a slenderness ratio from the bounding box, and a printability score from 0.1 to 1.0.
Model. Random Forest regressor (scikit-learn, 200 trees) on the 15 numeric features, 70/30 train/test split.
Selection. A weighted index across mass, volume, stress and predicted printability to rank the designs.
The dataset
Twenty rows, one per design. Each carries its generative-design settings, the solver's mass, volume and peak von Mises stress, the four slicer metrics, the slenderness ratio, the three flags and the score. The extremes show the trade-off:
DesignMassPeak stressScore
Baseline (hand-modelled)65 g15 MPa1.0
GD_Realistic_1 (SF 1.5, 3 mm, 45°)38 g13.3 MPa0.9
GD_Unrestricted_2_1 (SF 1.0, 3 mm)19 g20 MPa0.75
GD_Unrestricted_4_2 (SF 1.0, 2.5 mm, 70°)9 g80 MPa0.1
GD_Unrestricted_5_x (SF 1.0, 1.5 mm, 70°)12–13 g89–96 MPa0.1
The solver took the bracket from 65 g to 9 g by raising stress from 15 to 80 MPa and the slenderness ratio from 2.5 to 3.8, and by shrinking the base to almost nothing.
The peak stresses are the maxima from Fusion's linear static solver. They sit at sharp features and load points, so they compare designs rather than predict failure. Even so, the 80–96 MPa peaks on the lightest designs are above what PLA can carry, one more reason the index ranks them below the 19 g pick. The designs were generated at a safety factor of 1.0 or 1.5 for this term project; a bracket for real use would be re-run at a higher factor.
Results
Fig 1Feature importance across the 15 features.
Fig 2Predicted against assigned score on the six test designs.
Small-base flag, slenderness ratio and peak stress carry half the importance between them. Safety factor, minimum thickness and the unrestricted flag are at the bottom: the final geometry matters more than the settings that produced it. High peak stress tracks printability because the same aggressive optimisation that raises stress also thins the part.
The model scores R² 0.85 (MAE 0.095) on the six held-out designs, reproduced from the published script. I set the printability score partly from the three risk flags, and the same flags are inputs to the model, so the R² mostly reflects that scoring rule. The useful result is which measurable features carry the signal: base, slenderness and stress, not the solver settings.
Next steps for a real predictor: labels from repeated physical prints rather than judgement, the flags replaced by features measured automatically from the geometry, and more than one part family.
Physical check
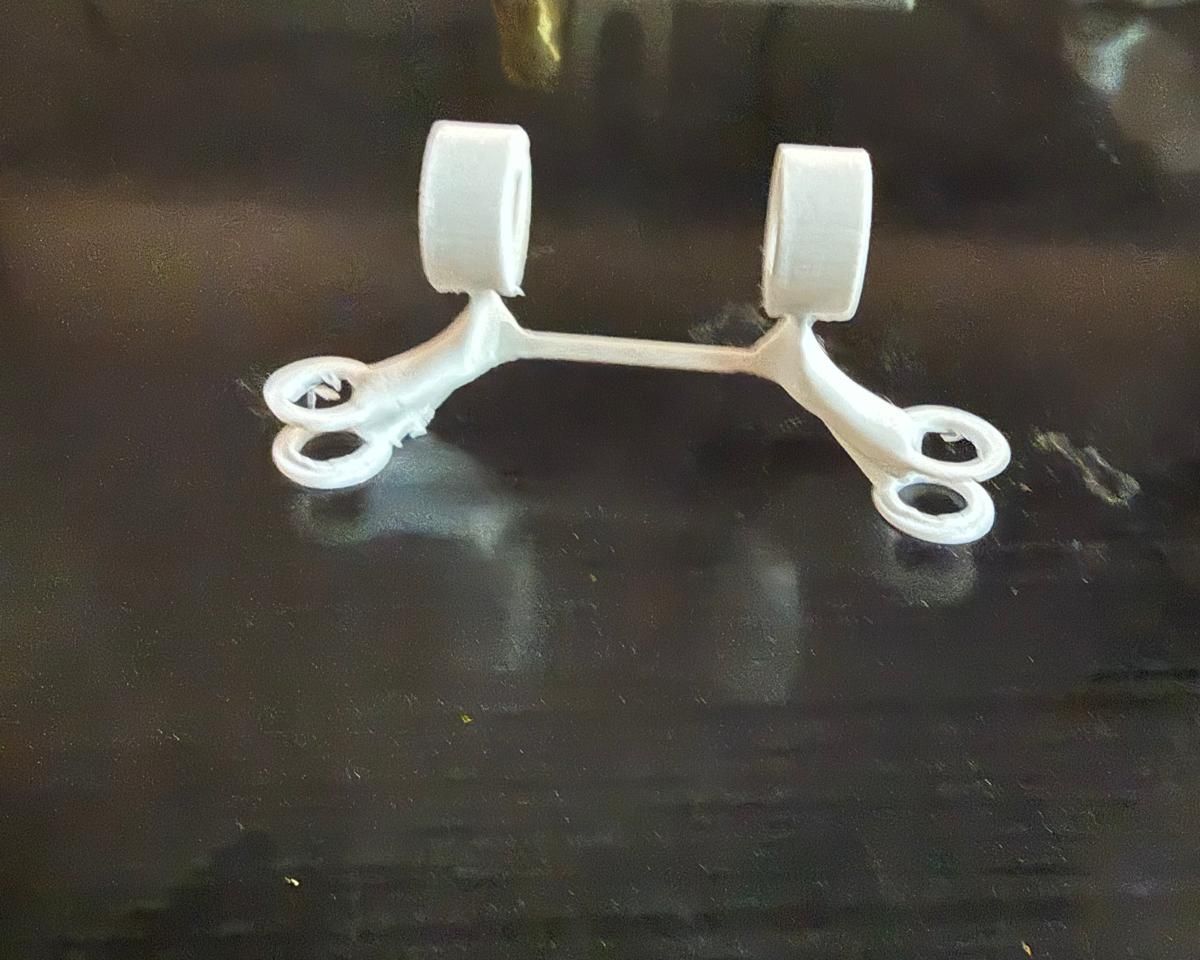
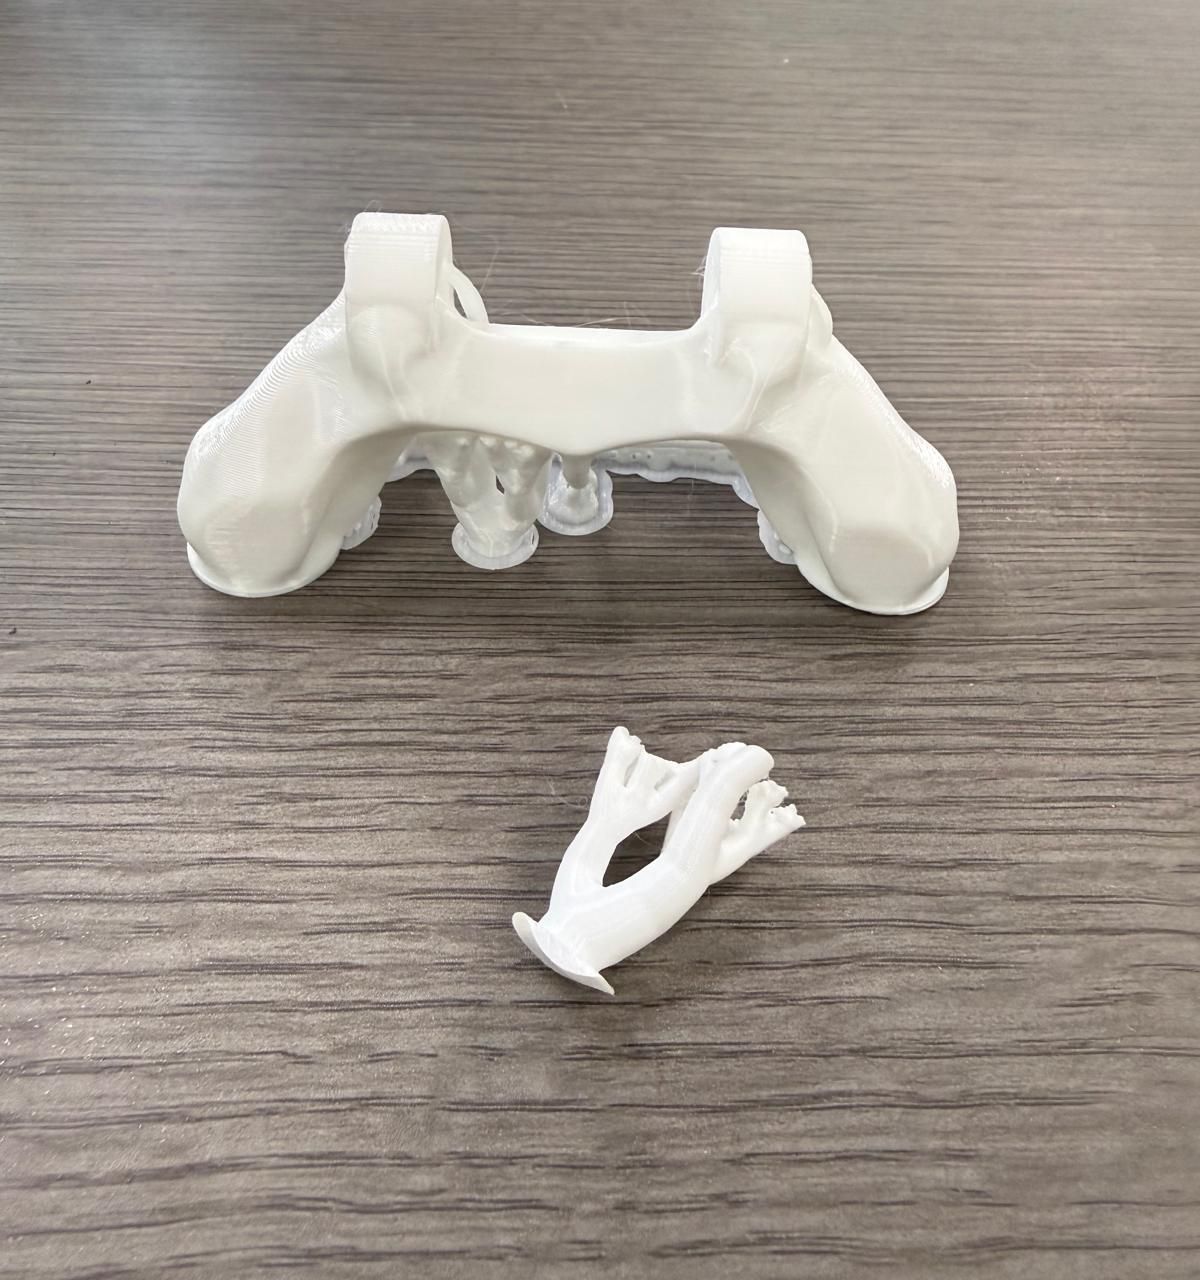
Four designs went to the printer: the baseline and three generative outcomes spread across the score range. The prints followed their printability scores. The baseline and GD_Unrestricted_1_2 printed cleanly. The organic designs needed more support contact and were more delicate off the plate. The lightest design, scored 0.1, is the spindliest of the set and the one that broke in handling.
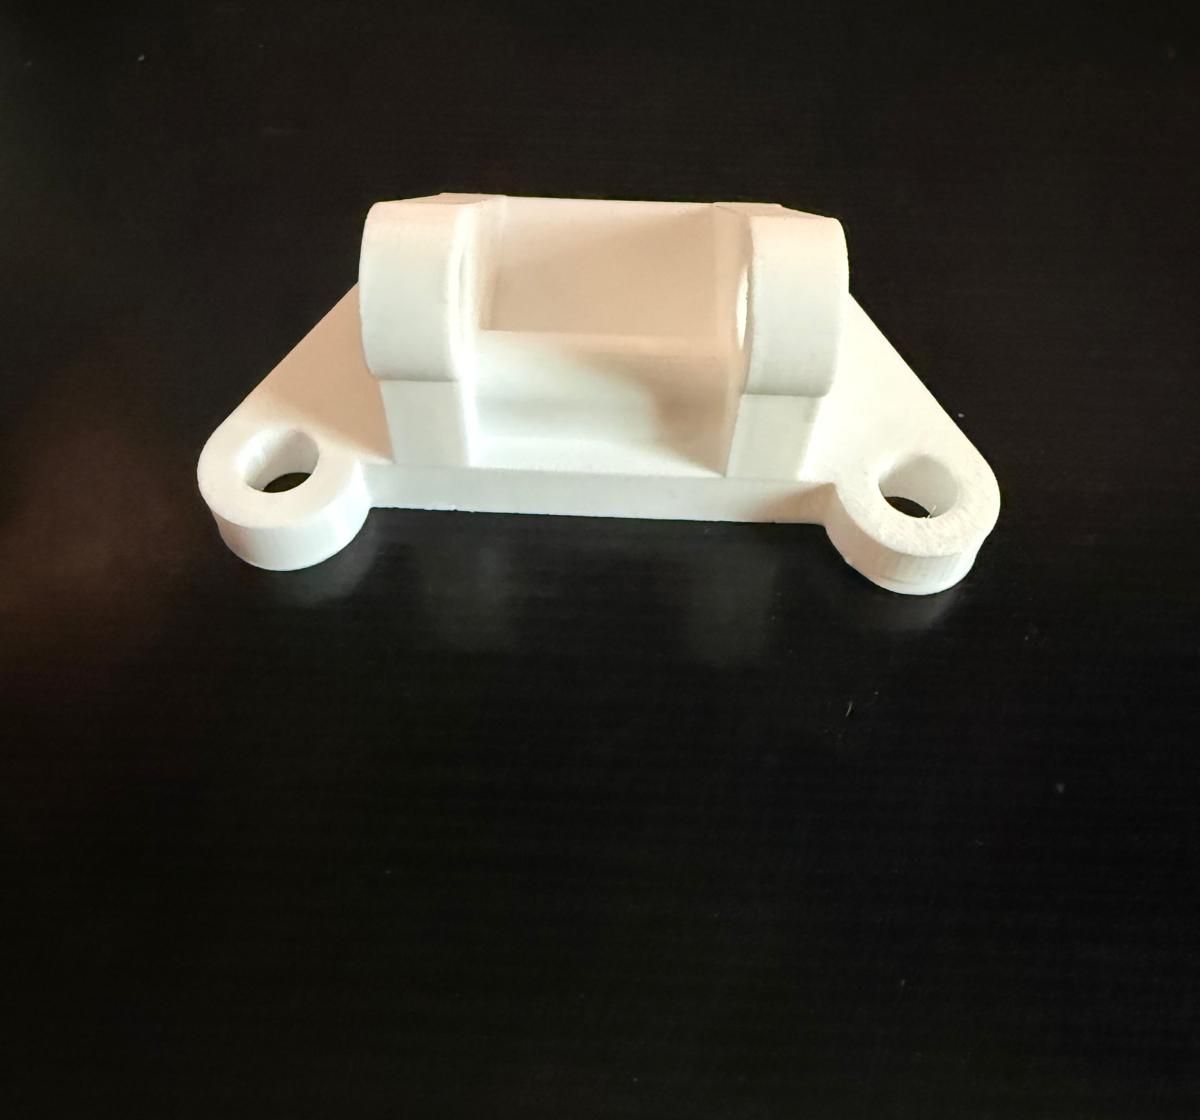
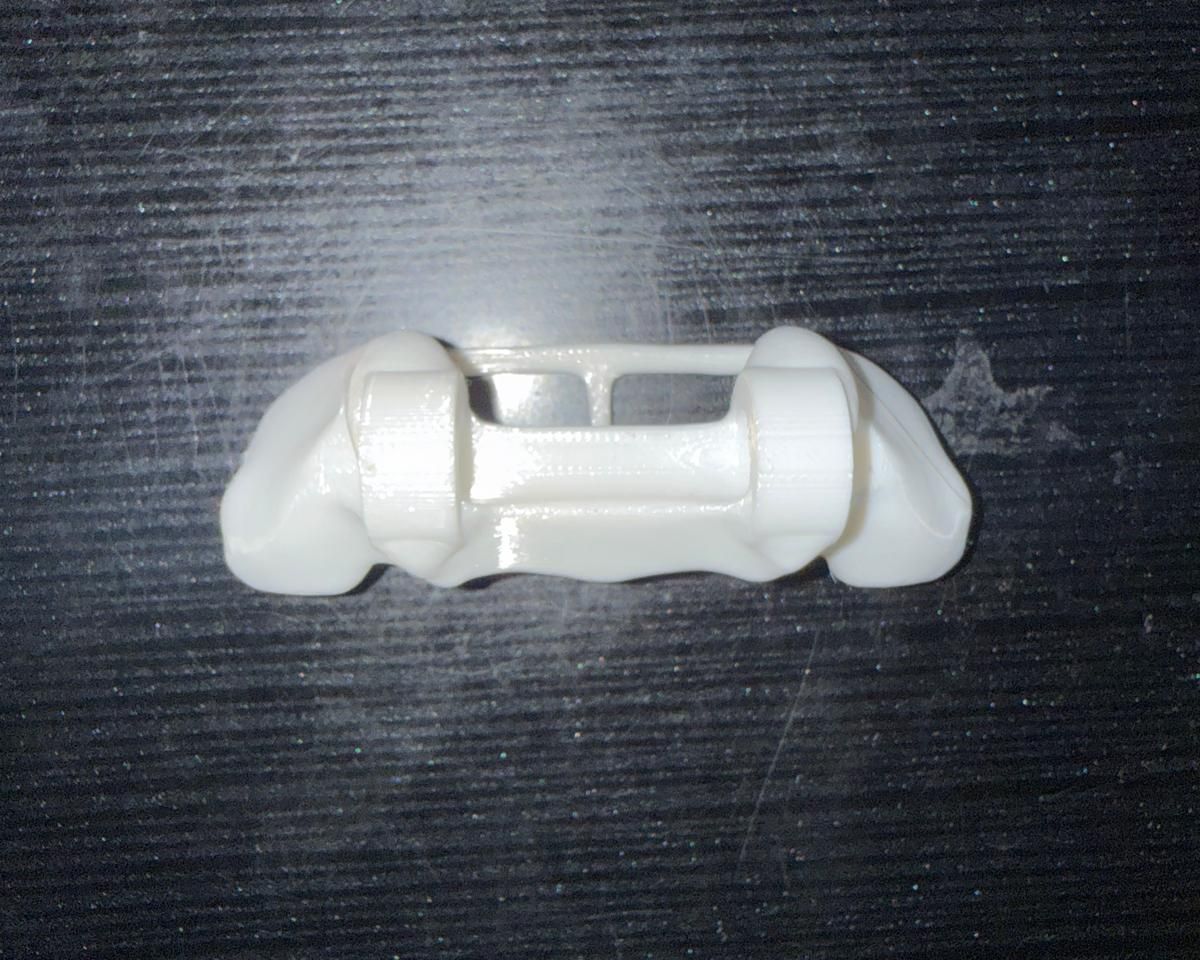
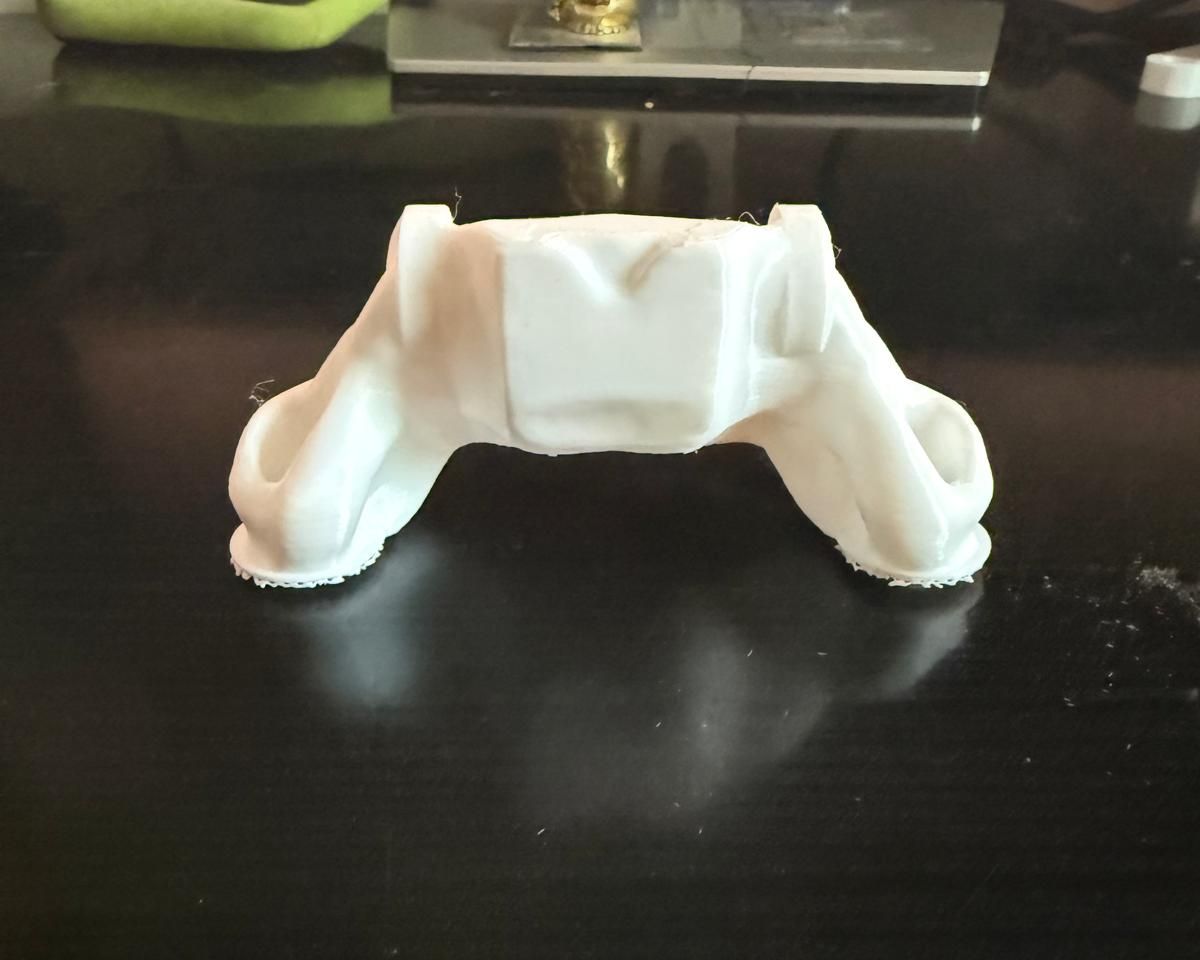
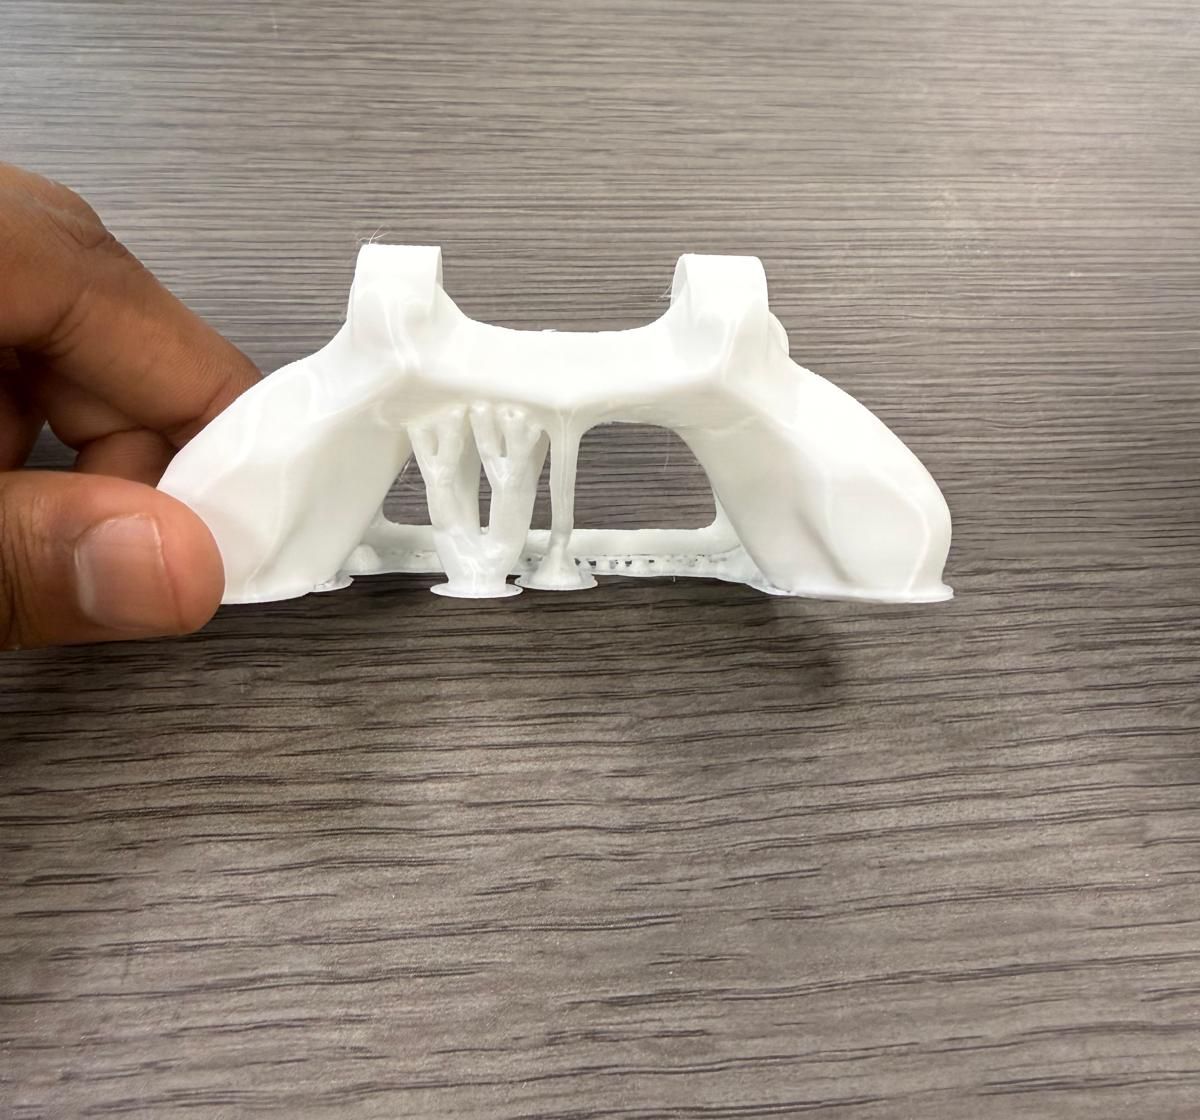
Fig 3Baseline: large base, blocky, score 1.0.Fig 4GD_Unrestricted_1_2: printed cleanly, score 0.85.Fig 5GD_Unrestricted_Only_6: organic, more support, score 0.8.
Fig 6GD_Unrestricted_4_2, the 9 g design: two rings on a thin bar, score 0.1.Fig 7The same design after handling, broken at the bar.Fig 8Support material still attached under the organic design.
Picking a design
Printability alone would pick the baseline, which is also the heaviest part. A weighted index balances four terms: 0.30 × (1 − mass) + 0.20 × (1 − volume) + 0.25 × (1 − stress) + 0.25 × printability, each min–max normalised across the twenty designs. The top of the ranking is GD_Unrestricted_2_1 at 0.82: 19 g, 20 MPa, printability 0.75. The baseline scores 0.49 and the 9 g design 0.55.
For a single material, mass and volume move together, so in effect half the index rewards a lighter part. That matches the generative-design objective, which was to minimise mass.
Key findings
Mass and printability pull apart. The solver's lightest designs were the hardest to print, which is why the selection index carries a printability term.
Geometry predicts printing. Base area, slenderness and thickness drove the printability score. The solver settings barely did.
Specification
ModuleME3261 Computer-Aided Design and Manufacturing, NUS; solo project, Aug – Nov 2025
ResultSelection index picked a 19 g, 20 MPa design; 4 test prints agreed with their printability scores (small qualitative check). Model R² 0.85 on 6 test designs (labels partly derived from input flags)
Printed4 designs on a Bambu Lab A1 Mini in PLA; outcomes consistent with the scores