The reactor and electrospinner designs are Rhoic's IP, so this page shows the brief, my process and the results, not photos, drawings or dimensions of those parts. Simulation plots keep their results and legends, with the part geometry blurred.
Coaxial reactor housing
Rhoic needed a pressure housing for its coaxial electrochemical reactor, and there was no existing design to start from. I took it from a blank sheet through design and analysis to a machined, sealed, tested part, and drew the revision for the next build.
Brief
Pressure10 bar design requirement
SealingFive interfaces, all gas-tight
ElectricalAn isolated electrical feedthrough
BuildMachinable by an outside shop; quick to iterate
How each requirement was checked
RequirementHow it was checkedResult
Hold 10 barHand calculation, SolidWorks FEA, cross-checked in Ansys (static, on yield)Analysed. Safety factor 1.7 for V1, 6.2 for the Rev B design
Gas-tight at five interfacesPressure-decay leak test at 50 psi (~3.4 bar), room temperatureTested. Under 1 psi drop over 30 min; held for hours on both sensors
Parts fit and assemble3D-printed fit check, then a fit test of the machined partsTested. Assembled as designed
Seal grooves to ±0.05 mmCalipers, micrometers and assembly checks on the returned partsInspected
The work ran in eight steps, in this order.
1. Design
CAD. The housing and its internal parts modelled in SolidWorks around the brief.
Design for machining. Standard drill and tap sizes, standard stock sizes, no undercuts.
Tolerancing. Specified to ISO 2768-mK, with ±0.05 mm on the seal grooves and seals sized for their target squeeze and fill.
2. Structural analysis
With the design drawn up, and before anything was printed or cut, I checked it against the 10 bar requirement: hand calculations first to bound the answer, then SolidWorks Simulation, then the whole study rebuilt from scratch in Ansys as a cross-check. The part that governs is the aluminium end cap, whose floor carries the pressure load.
The part geometry in every simulation plot below is blurred on purpose, since the design is Rhoic's IP. Stress contours, legends and results are untouched.
The wall and thread have large margins. The floor is the part to check: the two edge conditions put its stress between 74 and about 220 MPa, so I used FEA to find where it really sits and to capture the stress concentration at the floor-to-wall corner.
Model setup
Pressure on every wetted face, plus the load an internal part transfers to the floor, applied on its own face through a split line. The thread was held with a cylindrical-face fixture (radial free, axial and tangential fixed), so it behaves like a thread without over-constraining the part. Curvature-based mesh, refined at the corner. The model's reaction force matched the hand calculation to within 0.01%, which confirms the load went in as intended.
V1 result
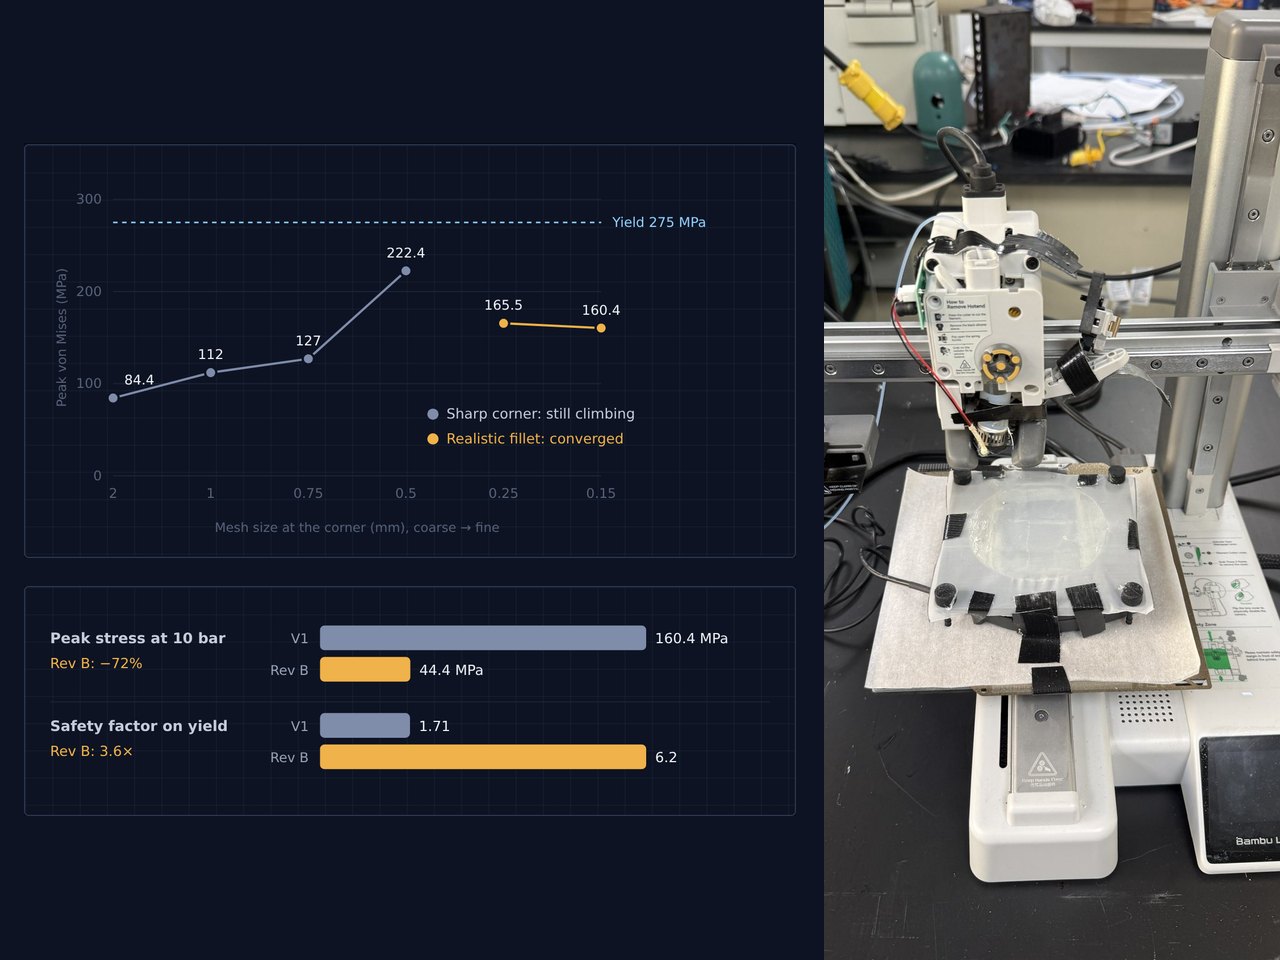
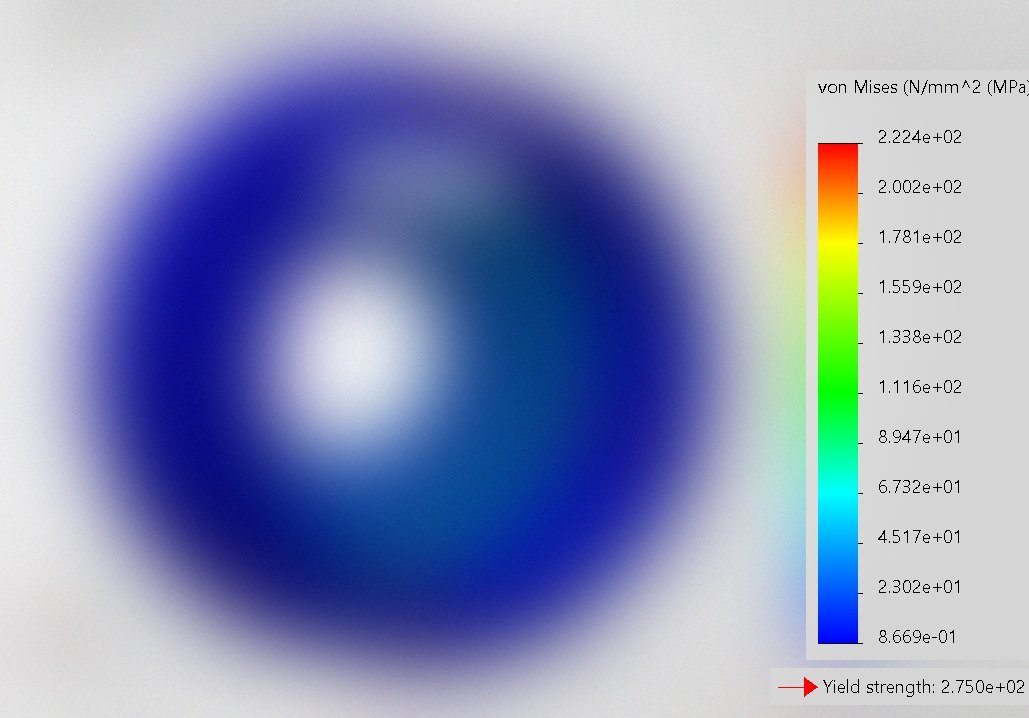
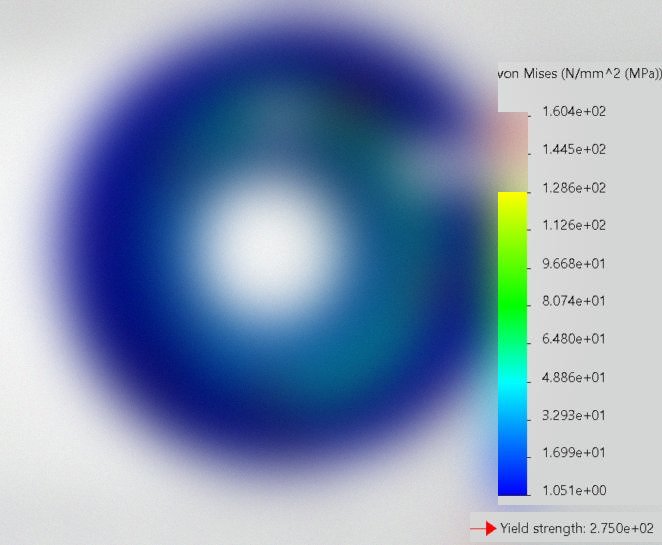
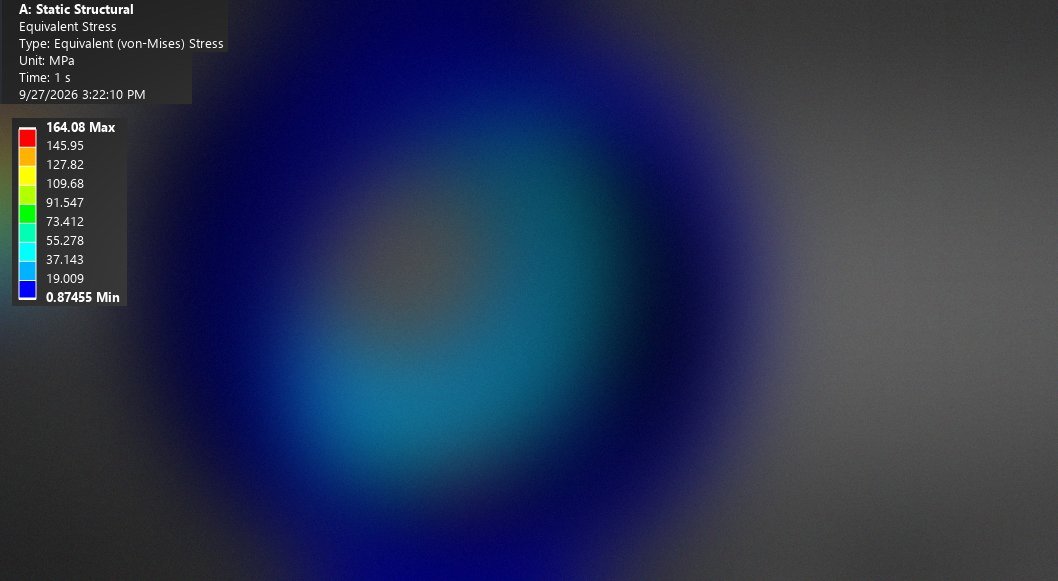
With the floor-to-wall corner modelled sharp, peak stress rose with every mesh refinement: 84, 112, 127, then 222 MPa. A perfectly sharp corner is a stress singularity, and a machined corner always has a tool radius, so I modelled a realistic minimum radius. That converged at 160 MPa, within 3.1% between the two finest meshes (2.5 million nodes).
Fig 1Mesh convergence at the floor-to-wall corner. The sharp corner keeps rising; the realistic fillet converges.
Fig 2Sharp corner, 0.5 mm mesh: 222 MPa and still rising with refinement.Fig 3Realistic fillet, converged: 160 MPa peak at the corner.
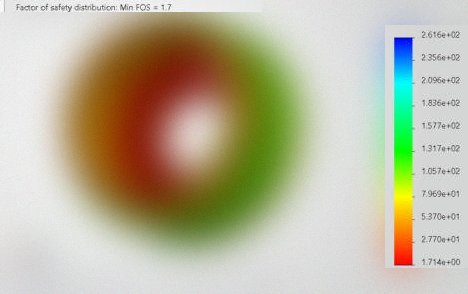
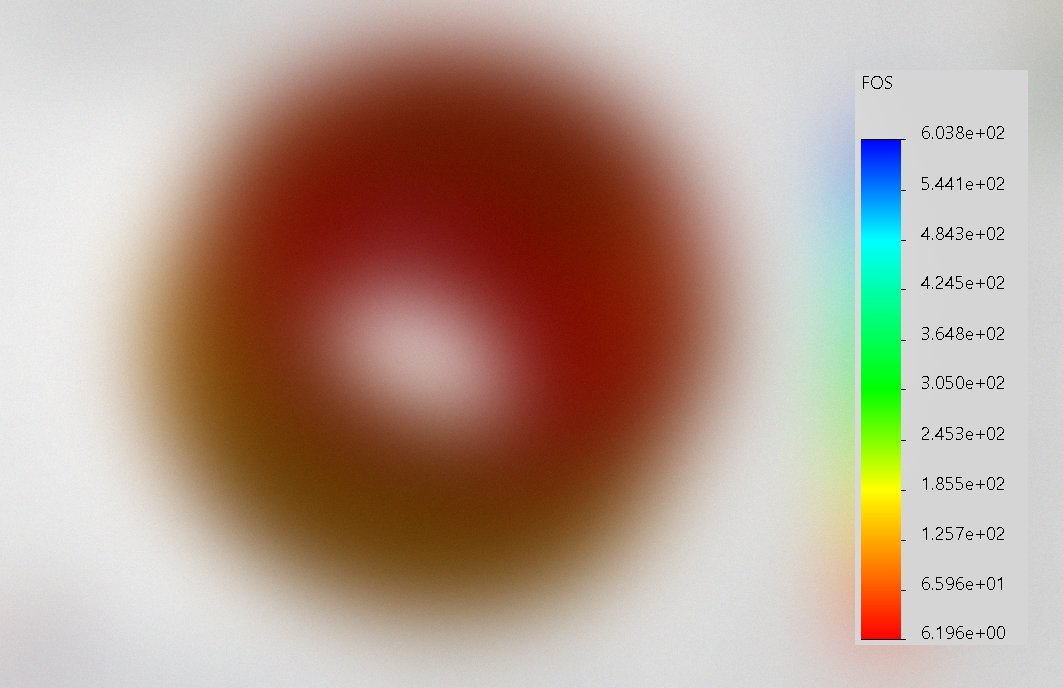
V1: 160 MPa peak, safety factor 1.71 on yield at 10 bar. V1 had a safety factor of about 5 at the 50 psi test pressure, enough margin to build and leak-test it. At the 10 bar design pressure it had less margin than I wanted, which Rev B fixes.
Fig 4V1 factor of safety: minimum 1.7, at the fillet.
Rev B: recommended revision
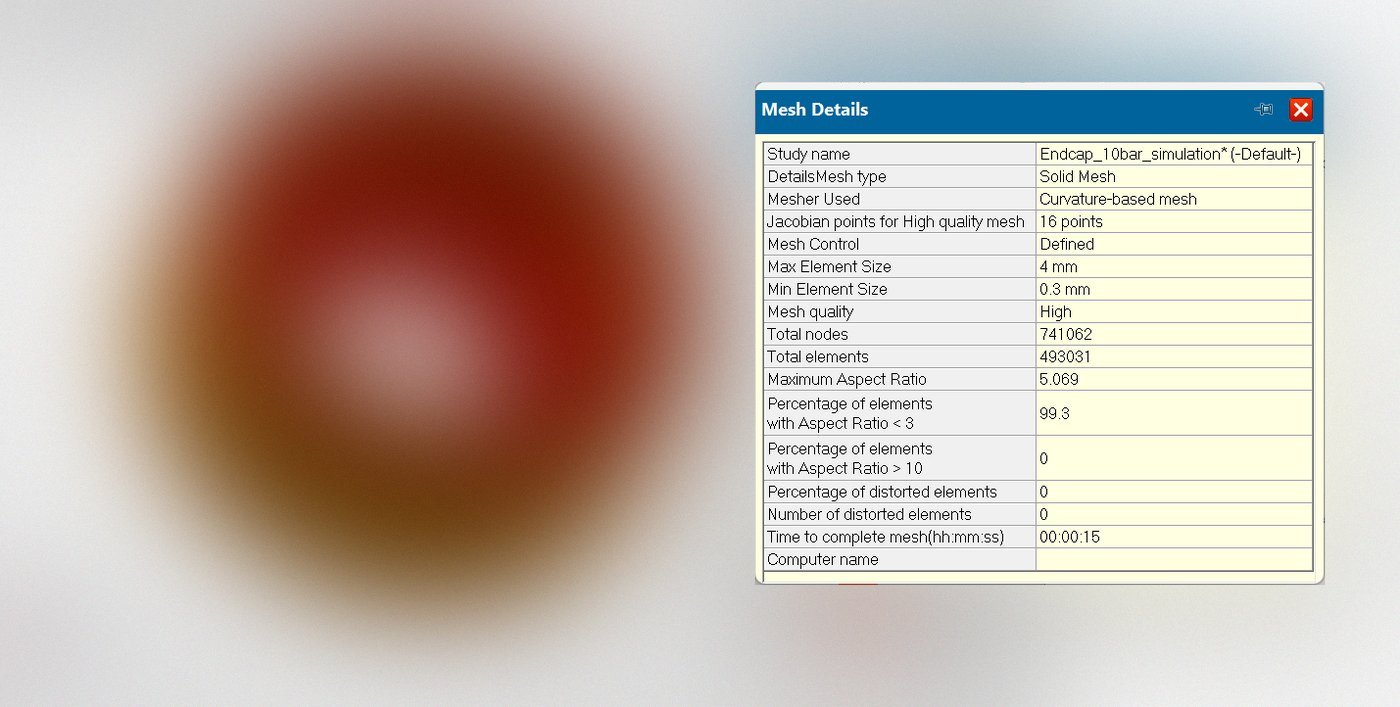
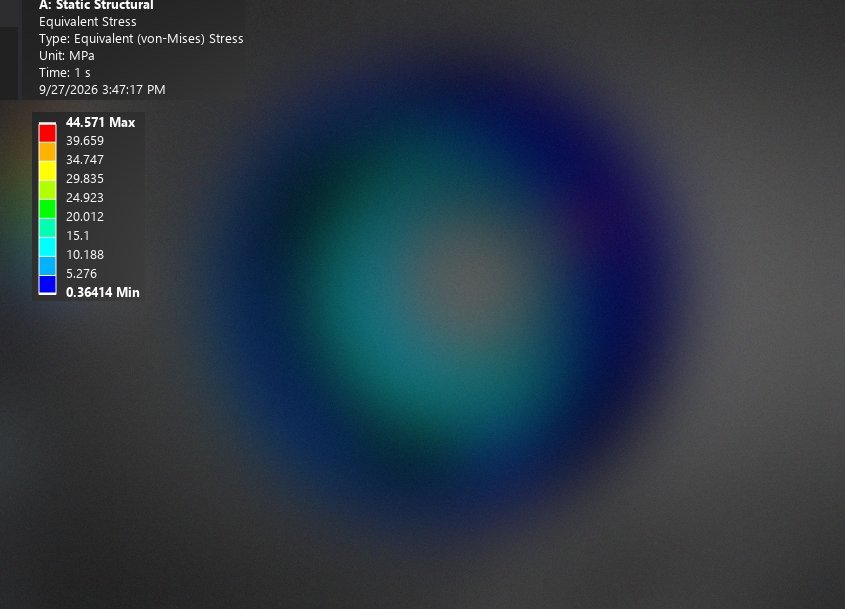
For the next build I specified two changes: a thicker floor, and a minimum fillet radius called out on the drawing. The hand calculation predicted about 45 MPa. The model gave 44.4 MPa, converged within 0.3% between two meshes, with the reaction matching again and 99.3% of elements under an aspect ratio of 3. The stress now spreads evenly around the fillet instead of peaking at one point, and the floor deflects 70% less.
Fig 5V1 against the recommended Rev B, from the converged SolidWorks models.
Fig 6Rev B: 44 MPa, spread evenly around the fillet.Fig 7Rev B factor of safety: minimum 6.2.
Show the Rev B mesh qualityFig 8Rev B mesh details: 741k nodes, 99.3% of elements with aspect ratio under 3, none distorted.
Cross-check in Ansys Mechanical
I exported both designs as STEP and rebuilt the study from scratch in Ansys Mechanical 2026 R1: same material, supports and loads, a quadratic tetrahedral mesh with face sizing on the fillet. The student licence caps the model at 128k nodes, so it ran at about 126k against 2.5 million in SolidWorks.
Fig 9Every Ansys result within 2.3% of SolidWorks. The largest gap is at the small V1 fillet, where the node cap forced a coarser mesh.
Agreement between the two solvers checks the model, not the physical part. The leak test is the physical check.
Hand calcSolidWorksAnsys
V1 peak von Mises74 MPa nominal160.4 MPa164.1 MPa (+2.3%)
V1 safety factor1.711.68
Rev B peak von Mises~45 MPa predicted44.4 MPa44.6 MPa (+0.4%)
Material assumed 6061-T6 (yield 275 MPa). The vendor did not state the temper, so Rev B specifies it.
3. 3D-printed fit check
Before committing to aluminium, I printed the housing and its inner parts and assembled them, to prove the fit and the assembly order on cheap parts first.
4. Fabrication
I released STEP files to an outside CNC shop. After their feedback I fixed a thread interference, and required a test fit before the parts shipped.
5. Fit test
I assembled the machined parts to confirm they went together as designed.
6. Checking
I inspected the returned parts with calipers, micrometers and assembly checks to ±0.05 mm.
7. Leak campaign and test
Sealing took two to three weeks across five interfaces. I worked from large leaks to small, and logged every attempt at each interface, which fed the V2 changes below.
Method. Leak-detector fluid first, then two pressure sensors, one upstream and one downstream of the housing, matched with a calibrated linear offset so they read the same with no leak. I charge the housing to 50 psi through the regulator, shut the supply valve and log both sensors. A leak shows as pressure decay, read on the downstream sensor (P2) against the upstream one (P1).
Mounting. Pegboard stand with vibration-damping holders, NPT and compression fittings to the test stand, and a vented enclosure around it.
Fig 12Two-sensor leak test, logged through the lab's Raspberry Pi data-acquisition stack.
Leak-tested at 50 psi (~3.4 bar) with gas at room temperature, against a pass criterion of under 1 psi drop over 30 minutes. It held for hours on both sensors.
8. After the test
Rev B drawing for the next build
I drew the recommended Rev B end cap on an A3 sheet to ISO GPS (ISO 1101), with general tolerances to ISO 2768-mK. It carries the two changes from the analysis, plus the controls the seal depends on. Datum A is the sealing face, since everything that matters for the seal is measured from it. Datum B is the thread axis, which locates the cap radially.
ControlOnWhy
FlatnessDatum A, the seal faceKeeps the face between two close planes, so the O-ring is squeezed evenly all the way round.
Perpendicularity to AThe closure threadA thread tilted to the seal face would load the seal unevenly.
Position at MMC to A and BClearance holesThe tolerance grows as the hole grows, which is functional and cheaper to machine.
±0.05 mmGroove width and depthHolds the O-ring at its target squeeze and fill.
Minimum fillet radiusFloor-to-wall cornerThe change the analysis called for.
Surface finishSeal facesNo radial scratches, since a radial scratch is a leak path across the seal.
The drawing itself stays with Rhoic.
V2 design changes specified
I wrote V1 up interface by interface and specified a V2 change for each of the twelve findings. The general ones are below; the rest are specific to the reactor and stay with Rhoic.
AreaV1 findingV2 change specified
Threaded jointsAn O-ring alone leaked around large threadsTapered pipe threads on sealed connections; PTFE tape as standard
Seal sizingGrooves sized by trial and errorGrooves designed around standard O-ring sizes
Fastener holesLeaked past bare screws, then crushed rubber washersMetal-ringed rubber washers
FittingsAn uncommon thread size slowed every swapCommon, lab-stocked sizes
Test accessCould not isolate which interface was leakingDedicated test ports in the gas path
Test methodLeak-detector fluid degrades PTFE tape with repeated usePressure decay first; gas detector as an alternative
ErgonomicsNothing to grip when tighteningWrench flats
End capsUnscrewing one joint could loosen anotherOpposite-hand end-cap threads
Sealing fixes from the leak campaign
Small fastener holes sealed. Sealing at the thread failed at small fastener sizes, so I put a washer under each inside nut to block the leak path at its source, and a metal-ringed rubber washer on the head side.
Standard O-ring grooves. Cut and glued O-rings either leaked at the cut or could not be serviced, so the V2 grooves are designed around standard sizes.
Two-stage leak finding. Leak-detector fluid for the large leaks, then matched pressure sensors for the small ones, interface by interface until all five held.
Process and drawing changes
Written confirmation with the vendor. Critical dimensions are now confirmed in writing at the end of every design conversation, and the shop reads back critical features before cutting.
Seal-face finish on the drawing. Rev B specifies surface finish on the O-ring faces.
Stress-critical features called out. Rev B specifies the minimum corner radius the V1 margin depends on, and the material temper.
Furnace automation
In October 2026 I built a Raspberry Pi 5 controller to run the lab's 28 h heat treatments on its atmosphere furnace unattended. The first automated run came ten days after the first commit.
Furnace automation in numbers
28 hHeat-treatment programs, built to run unattended
10 daysFrom first commit to the first automated run
7Relay channels driving 6 valves and the vacuum-pump SSR
3 busesModbus RTU, RS-232 and I²C, polled every second
~20Software safety trips, plus a separate watchdog process
227Automated software tests, plus two independent code reviews
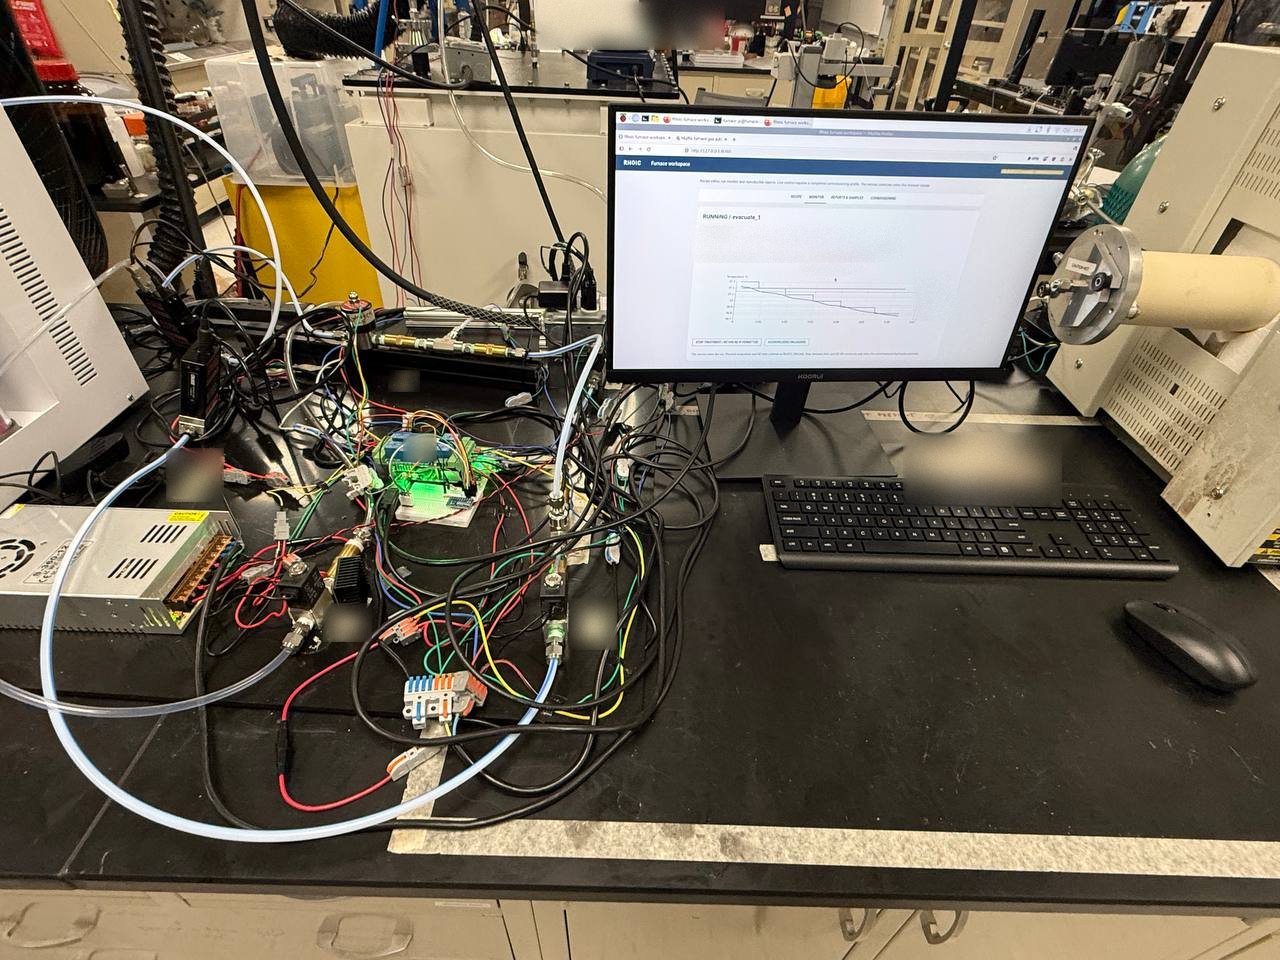
Fig 13The controller bench beside the furnace, with the browser GUI running a vacuum purge. Gas readings and handwritten labels are blurred.
What it does
Rhoic heat-treats electrospun nanofibre mats in an Across International GCF1200 atmosphere muffle furnace with a Eurotherm 3204 controller. Before this, every run meant someone programming the Eurotherm by hand and switching gas valves and the vacuum pump at the right temperatures, on runs up to 28 hours. The Raspberry Pi now does all of it:
it programs the controller;
it switches gas, vacuum and exhaust at each stage;
it holds the chamber at or below 0 psig during purges;
it logs every reading;
it shuts itself down safely on any fault.
I did all of the wiring, installation, integration, code, testing and deployment myself.
Fig 14The system: the Pi talks to the furnace controller, the relay board and the instruments, with a separate watchdog process, a run database and a browser GUI.
Electrical
Relays. A Sequent 8-relay HAT on I²C. It switches four 110 V AC solenoid valves, each through a T2A slow-blow fuse, and two 12 V DC valves with 1N5408 flyback diodes, powered from a 360 W 12 V supply.
Earthing and wire. Every valve body is earthed, and the wiring is 18 AWG rated to 300 V.
Vacuum pump. Runs on a 25 A solid-state relay. A relay channel switches the Pi's 5 V into the SSR input, and the SSR switches the pump's mains line.
Fail-safe states, in hardware. Every gas valve is normally closed, so de-energised means shut. The exhaust valve is normally open, so a power loss or a pulled plug shuts the gas and vents the chamber without any software. A stalled control loop is caught by the watchdog process. The safe state is all relays off.
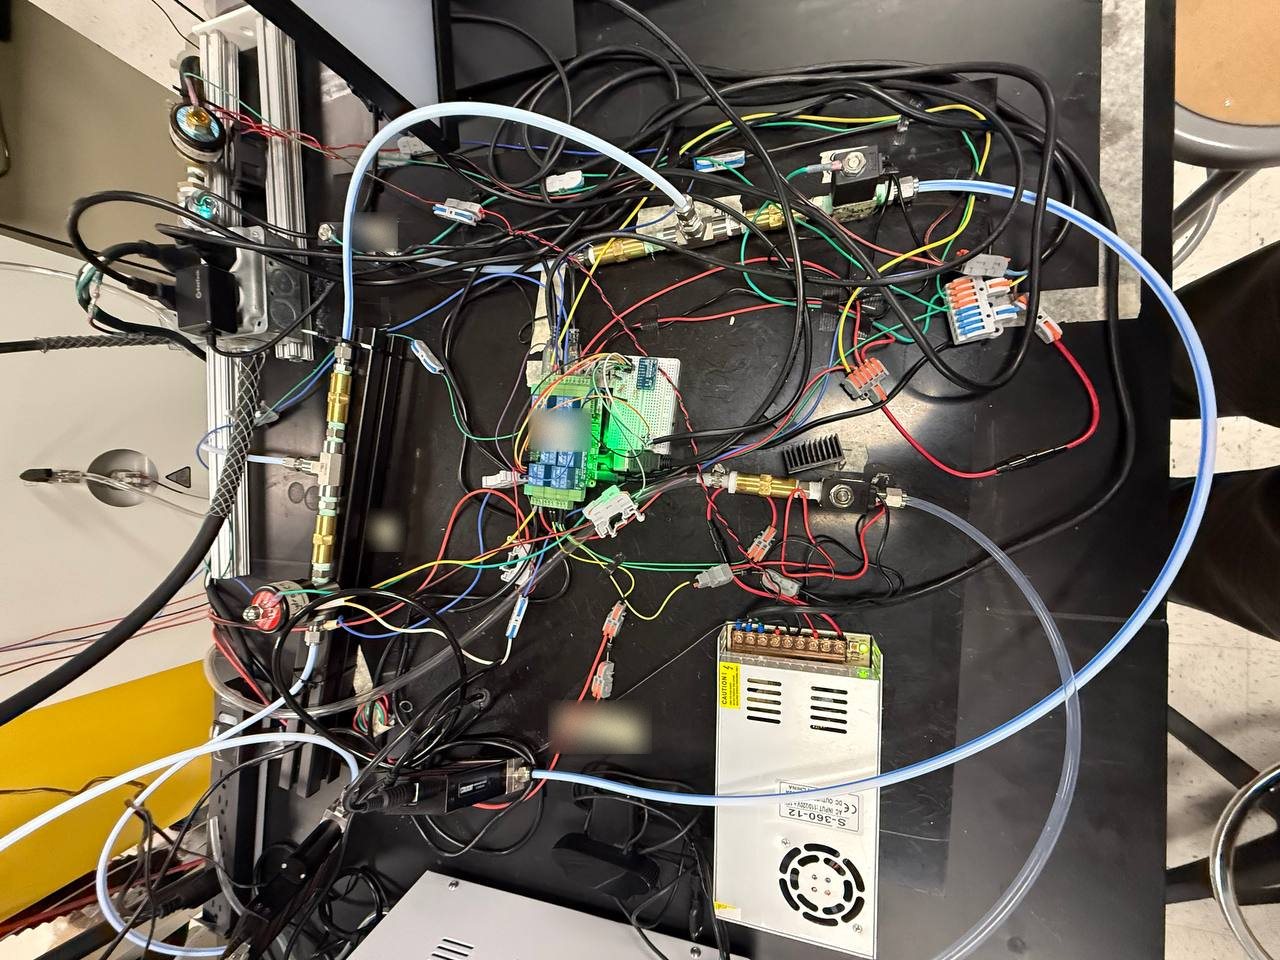
Fig 15The controller bench from above: Pi 5 and relay HAT (centre), solenoid valves, the pump SSR and the 12 V supply (bottom right). Handwritten labels are blurred.
Instruments and control
Eurotherm 3204 over Modbus RTU (9600 8N1). The Pi writes the ramp and dwell program once per run and reads it back. After that it only sends run, hold and reset, which protects the controller's EEPROM. The heater power cap is held in the Eurotherm itself, so it applies even if the Pi stops.
Two Alicat mass-flow instruments over RS-232, a 25 SLPM meter and a 20 SLPM controller. The controller runs closed-loop setpoint control with read-back.
Pressure and gas sensing. A pressure transducer read through an ADS1115 ADC, and an oxygen sensor on I²C.
Fixed serial ports. Serial ports are pinned by device ID, so they never swap.
Valve switching. Break-before-make, with software interlocks and a read-back of every relay after each change.
Start gate. A 10 s flow-verification check must pass before Start unlocks.
Watchdog. A separate process on the Pi forces a safe shutdown if the control loop stalls for 60 s.
Safety trips. About 20 software trips are checked every second: overtemperature, pressure, flow, stale sensors, heater above its cap, relay mismatch, controller state and stage timeouts.
Data. Every reading goes to SQLite on the Pi. A browser GUI (FastAPI) shows the run live, reports are generated automatically, and the raw-data archive is checksummed.
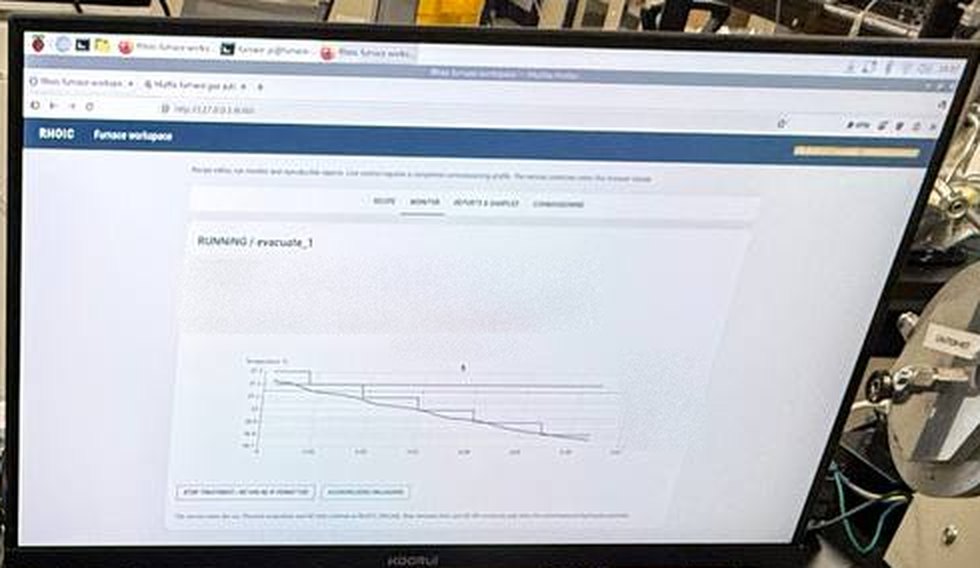
Fig 16The browser GUI during a vacuum purge: run state and the temperature trace against setpoint. The readings row is blurred.
Validation
Each stage passed before the next one was attempted:
Simulator and browser tests. The full sequence against a simulated furnace and instruments.
Read-only instrument checks. Every instrument read back before anything was allowed to write.
Eurotherm programming. Program written, read back and verified against the front panel.
Gas-only feedback loop. Flow control and valve sequencing with the heater off.
Full run on the real furnace. Heat and vacuum together, end to end.
227 automated software tests and two independent code reviews. The first automated heat-treatment run on the real furnace was in October 2026.
Electrospinner redesign
The lab's electrospinner worked, but it wasted polymer, its output was limited, and its electronics were wired ad hoc across the floor. I rebuilt it as one integrated electromechanical machine and ran the first successful spin on it.
GoalWhat I didResult
Less wasteRedesigned the emitter; five printed iterations to get a clean, consistent spin~75% less polymer per run, calculated from the old feed's dead volume and measured over ten runs
More outputReworked the emitter and collector layoutDouble the measured output per run
Precise motionFive NEMA 23 stepper axes under an Arduino; wrote and tuned the motion codeRepeatable, coordinated motion from one controller
Safe at 50 kVBonded and earthed the frame; control panel; one e-stop that cuts motor power and high voltage togetherOne integrated machine instead of floor wiring
EMI. The controller froze only when the transformer was energised, so the cause was high-voltage interference. Ferrite chokes, decoupling capacitors, a shielded enclosure and a Faraday cage fixed it.
Transformer fault. A transformer shorted through the frame and destroyed an amplifier. I traced the root cause and moved the transformer onto an isolated mount.
Structure. Replaced printed structural parts with metal brackets and rails. A wobble that vibrated a set screw loose mid-spin was fixed with a second bearing support.
Ultrasonic coating rig
Coating samples by hand spray was not repeatable. Commercial ultrasonic spray coaters cost USD 50k–150k+. I ran a build-versus-buy comparison (benchtop 3-axis routers against a converted 3D printer, with Z-height as the deciding constraint) and built one from a Bambu Lab A1 Mini.
Conversion. Replaced the hotend with an ultrasonic atomiser in printed mounts, and reused the printer's frame, motion and enclosure.
Control. Custom Python drives the printer directly over local MQTT with it in LAN-only developer mode, bypassing the vendor software: homing, Z-height and a serpentine coverage path.
Process problems. Solved clogging and dosing problems so results repeat from run to run.
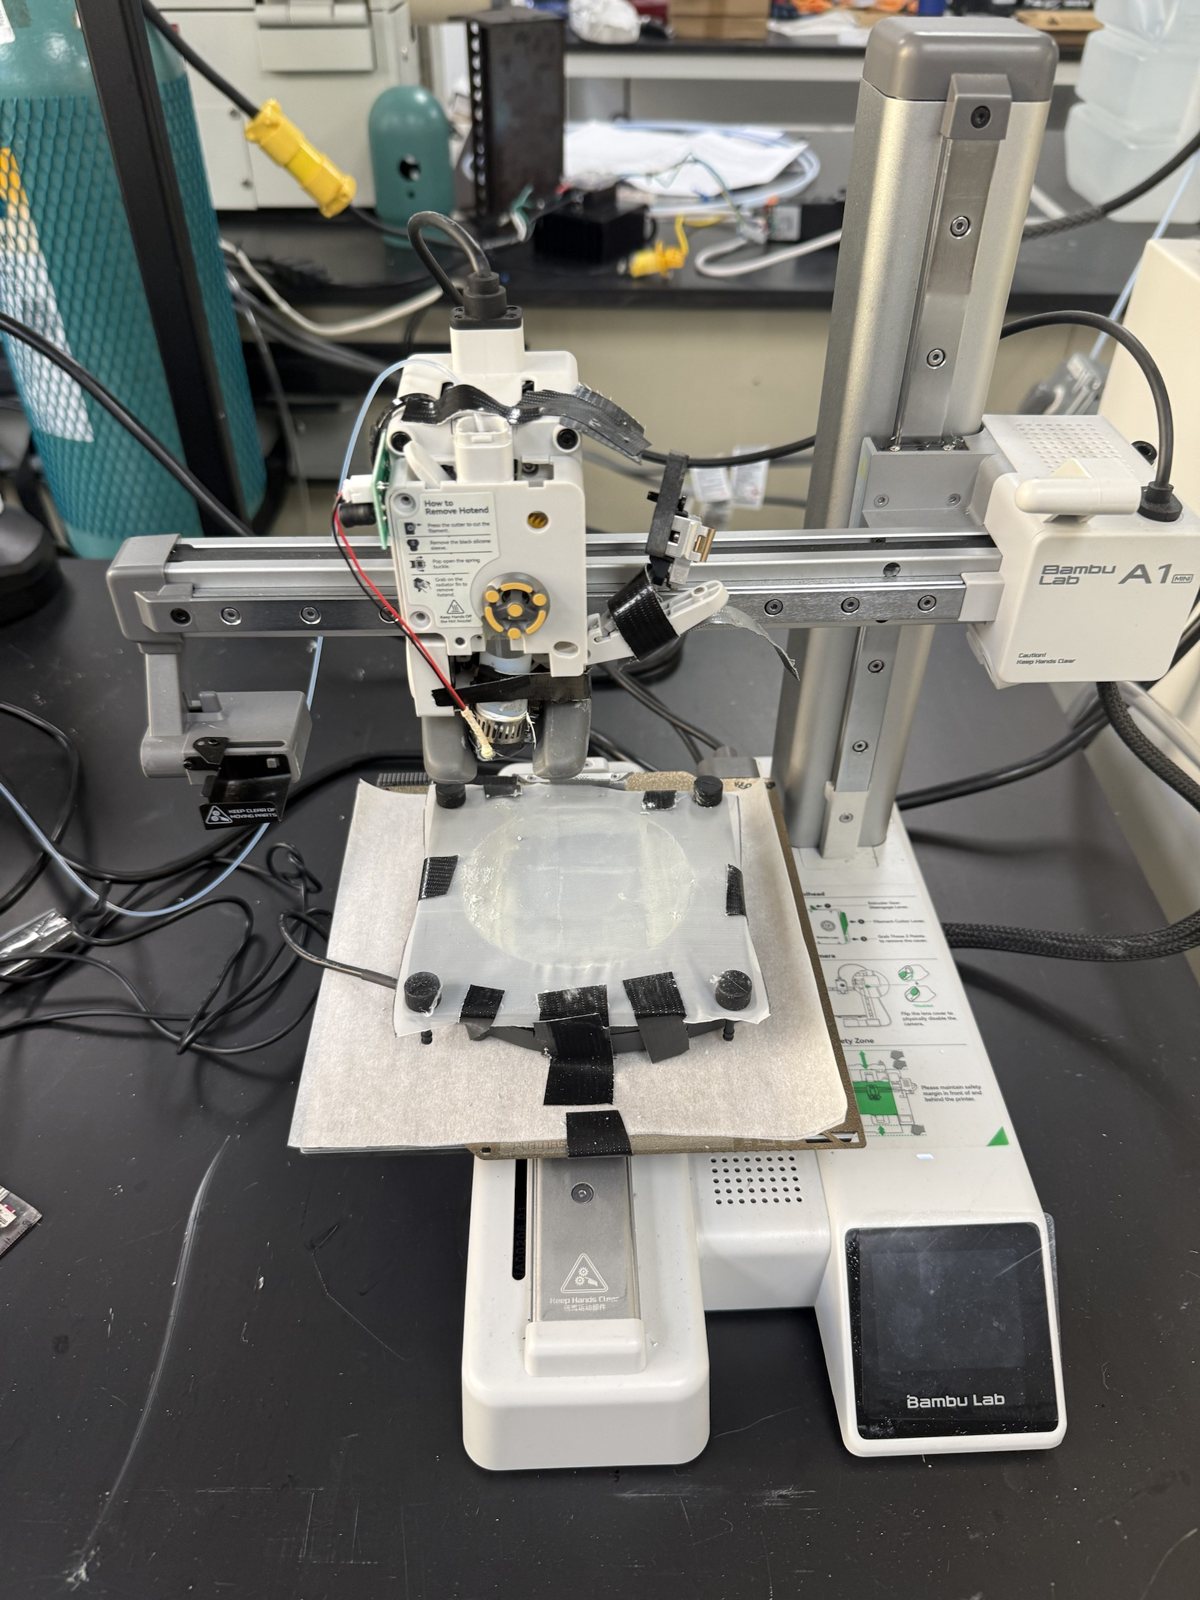
Fig 17The converted Bambu Lab A1 Mini. The atomiser sits where the hotend used to, and the sample is taped flat over the bed.
Deposition efficiency (material on the sample over material sprayed, by mass balance) went from about 0.1–0.5% with a hand spritzer to about 30–40%, repeatable from a fixed height and a metered dose. It is now the lab's standard coating method.
Test fixtures
I built capacitance and impedance test stands to characterise samples, then adapted a commercial test cell for reaction testing.
Three generations of test stand. Parallel copper plates on printed bodies, the third with a guard ring taken from the literature.
Meter error, measured. A controlled 1.0–3.0 mm air-gap sweep characterised the Keysight U1733C LCR meter's parasitic offset and cut it from about 19 pF to about 14 pF.
A correction you can trust. The meter's own null function proved unreliable, so I built a fixed-offset correction from repeated empty-fixture baselines and checked it against PLA, silicone rubber and HDPE of known permittivity. Results stayed consistent across sample shapes.
Beyond the meter's range. A DIY impedance sweep on a PicoScope (signal generator, cell and a 10 kΩ divider, 50–2000 Hz) covers a band the LCR meter can't reach, cross-checked against the meter where they overlap.
Finding the stray capacitance. Traced a more than fourfold gap between calculated and measured empty-fixture capacitance to parasitic paths between the probe points, and showed that probe placement drove the result.
Test-cell sealing. Cut PTFE sub-gaskets with a printed gasket-cutting jig I designed, and brought the commercial test cell's leakage down to about 1 psi.
Trust results only after the controls. Co-designed with the CEO a set of control experiments, blank runs and a one-variable-at-a-time test plan, run before we trusted the first positive results.
Instrumentation and gas control
DAQ stack. Built end to end on a Raspberry Pi 4: Type-K thermocouple via MAX31855 over SPI, 4–20 mA pressure transducer via ADS1115 over I²C, a gas sensor over UART, and mass flow via an Alicat mass-flow controller over RS-232. Logged to InfluxDB, with a Grafana dashboard and a Flask control page.
Mass-flow control. A browser UI for the Alicat with multi-step flow recipes, tare, custom ramps, a flow-deviation alarm and valve hold.
Flow analysis. Ran a Stokes-regime drag analysis showing that process stability, not material strength, sets the safe flow ramp rate, and built ramp limits and alarms into the control UI. The drag force came out about 87,000 times below the material's tensile limit.
Getting the readings right. Found the mass-flow controller set for the wrong gas and reference conditions, and corrected both so reported flows were physically right.
Debugging. Fixed an ADC ground offset with a star-ground layout, found a UART overlay silently taking over an SPI pin, unified Pi 4 and Pi 5 device paths with udev rules, and removed a filter that had been throwing away genuine zero readings.
Recovery and handover. Rebuilt the whole stack after a Pi died from heat (re-hosting, restoring scripts and databases, rewiring), then wrote the system reference, operator guide and handover documents for the incoming electrical engineer.
Materials audit. Audited the test stand's wetted materials for chemical compatibility and sourced replacements. Replaced an improvised needle valve with a proper back-pressure regulator.
Summary
CompanyRhoic, San Francisco. Four-person pre-seed startup
RoleMechanical engineering intern (NUS Overseas Colleges); also my final-year project
PeriodJan – Dec 2026
HousingAluminium, 10 bar requirement, five sealed interfaces; CNC-machined, inspected to ±0.05 mm
AnalysisHand calcs, mesh-converged SolidWorks FEA and Ansys Mechanical within 2.3%; reaction matched to <0.01%; FOS 1.71 (V1), 6.2 (recommended Rev B)
DrawingRev B for the next build: ISO GPS / ISO 1101, ISO 2768-mK; datums on seal face and thread axis
Test50 psi gas, room temperature, <1 psi drop over 30 min
FurnaceRaspberry Pi 5 controller built for unattended 28 h heat treatments; ~20 software safety trips; 227 automated software tests
Electrospinner~75% less polymer per run; 2× output; five stepper axes; 50 kV
Coating rigDeposition efficiency 0.1–0.5% → 30–40%; now the lab standard
InstrumentationPi DAQ: thermocouple, pressure, gas sensing, mass flow → InfluxDB + Grafana; Alicat MFC web control